Monte Carlo State-Value Estimation for BlackJack
I’ve been looking into reinforcement learning lately to create a racing agent.
As part of this process, I’m reading Reinforcement Learning: An Intro 2nd Edition by Sutton & Barto as my background in ML is supervised/unsupervised learning (blind source separation, variance pretraining). It’s not too useful for my project implementation as I’m experimenting with newer methods like PPO and reward design, but it helps me build a stronger foundation and intuition.
Chapter 5 (Monte Carlo Methods) shows an interesting looking plot of the state-value estimation of an arbitrary player strategy in BlackJack. The plot tells us what the expected return is for a given state under the following strategy: player hits until >= 20 and dealer hits til >= 17.
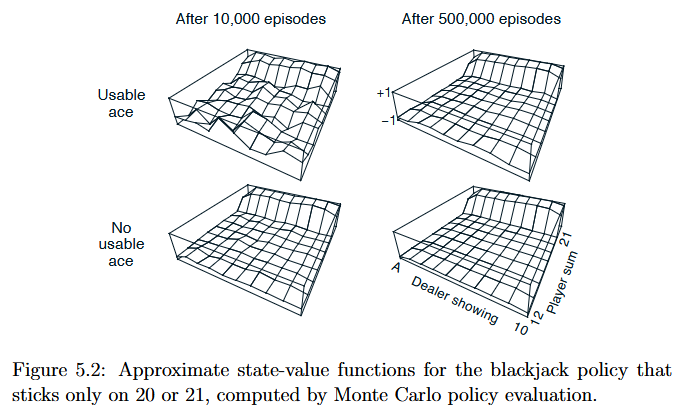
I wanted to try and recreate this from scratch in Python out of curiosity. Pdfs of the book float around online, such as here (above fig from pdf pg 130).
More Info on the Environment
Agent env is standard BJ, with rewards {1, -1, 0} for winning, losing and drawing. We assume an infinite deck, and the agent’s observation space is their current hand value, whether they have a usable ace, and the visible dealer card. The environment auto hits the player to > 11 so we can’t have > 1 usable ace (if you were wondering why usable ace is binary).
This gives us an observation space of 200 discrete states (Player hand value [12, 21] = 10 states, Dealer Card [A, 10] = 10 states, Usable Ace {0, 1} = 2 states). The player can hit or stand which is a discrete action of 2 states.
The value estimation formula can be found in the core code in the next section, we estimate the value using V(state) = V(s) + (G - V(s))/N where V is the value, G is return from this state to episode end, and N is the total # of times we reached the state.
Code
Core logic to run the MC sim is at core.txt
To get the plots, run sweep.txt (you’ll need core as well, rename both to .py files)
Results
The following plot shows the value estimation improving from 1K to 50K episodes. The usable ace cases are rarer so it takes a bit longer for the values to converge.
Here’s what it looks like after 500K episodes (much closer to the book image than the 50K episode one from above).
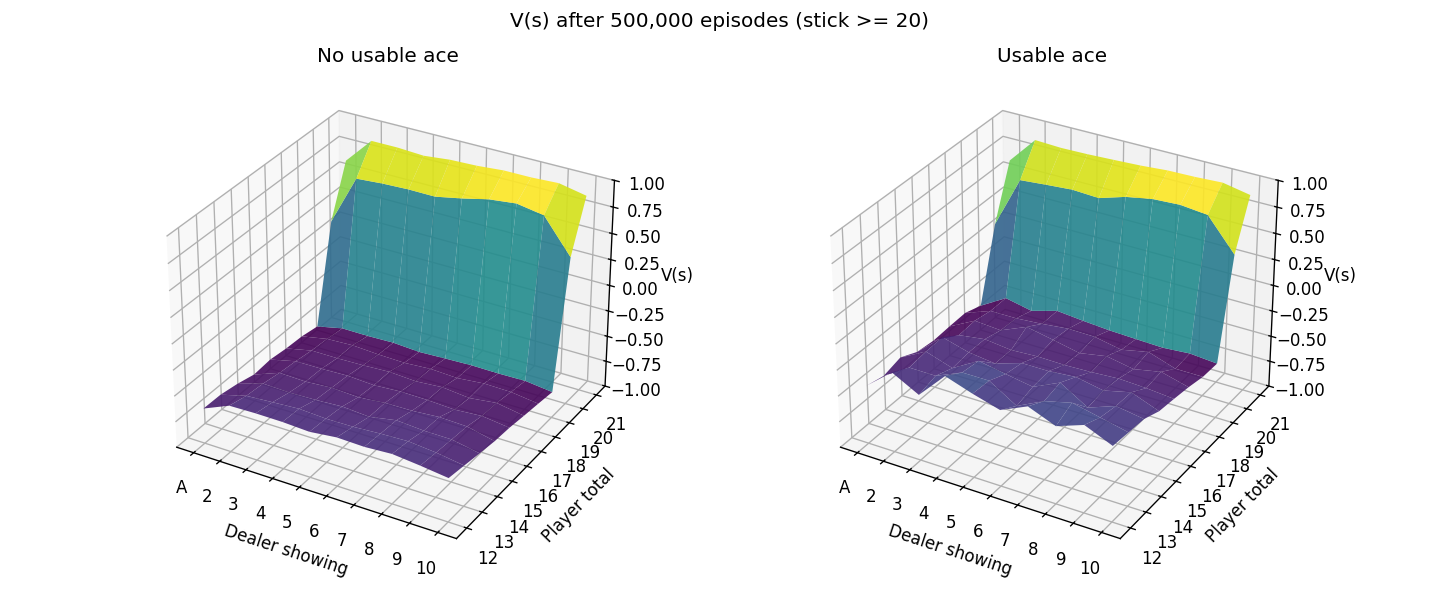
Notice how most of the plot is dark blue/purple? That means we’re expected to lose at that point since our strategy of hitting til 20 is suboptimal compared to the dealer one. Let’s try playing the same strategy as the dealer instead.
Much better, the brighter colors (higher values) show that our new strategy doesn’t lose as hard as before.